Analyze accelerometer data with Apache Spark and MLlib
| The past months I grew some interest in Apache Spark, Machine Learning and Time Series, and I thought of playing around with it. |
In this post I will explain how to predict user’s physical activity (like walking, jogging, sitting…) using Spark, the Spark-Cassandra connector and MLlib.
The entire code and data sets are available on my github account.
This post is inspired from the WISDM Lab’s study and data (not cleaned) come from here.

A FEW WORD ABOUT APACHE SPARK & CASSANDRA
Apache Spark started as a research project at the University of California, Berkeley in 2009 and it is an open source project written mostly in Scala. In a nutshell, Apache Spark is a fast and general engine for large-scale data processing. Spark’s main property is in-memory processing, but you can also process data on disk and it can be fully integrated with Hadoop to process data from HDFS. Spark provides three main API, in Java, Scala and Python. In this post I chose the Java API. Spark offers an abstraction called resilient distributed datasets (RDDs), which are immutable and lazy data collections partitioned across the nodes of a cluster.
MLlib is a standard component of Spark providing machine learning primitives on top of Spark which contains common algorithms (regression, classification, recommendation, optimization, clustering..), and also basic statistics and feature extraction functions.
If you want to get a better look at Apache Spark and its ecosystem, just check out the web site Apache Spark and its documentation.
Finally the Spark-Cassandra connector lets you expose Cassandra tables as Spark RDDs, and persist Spark RDDs into Cassandra tables, and execute arbitrary CQL queries within your Spark applications.
AN EXAMPLE: USER’S PHYSICAL ACTIVITY RECOGNITION
The availability of acceleration sensors creates exciting new opportunities for data mining and predictive analytics applications. In this post, I will consider data from accelerometers to perform activity recognition.
The data in my github account are already cleaned.
Data come from 37 different users. Each user has recorded the activity he was performing. That is why something the data are not relevant and need to be cleaned. Some rows are empty in the original file, and some other are misrecorded.
DATA DESCRIPTION
I have used labeled accelerometer data from users thanks to a device in their pocket during different activities (walking, sitting, jogging, ascending stairs, descending stairs, and standing).
The accelerometer measures acceleration in all three spatial dimensions as following:
- Z-axis captures the forward movement of the leg
- Y-axis captures the upward and downward movement of the leg
- X-axis captures the horizontal movement of the leg
The plots below show characteristics for each activity. Because of the periodicity of such activities, a few seconds windows is sufficient to find specific characteristics for each activity.
We observe repeating waves and peaks for the following repetitive activities walking, jogging, ascending stairs and descending stairs. The activities Upstairs and Downstairs are very similar, and there is no periodic behavior for more static activities like standing or sitting, but different amplitudes.
DATA INTO CASSANDRA
I have pushed my data into Cassandra using the cql shell.
https://gist.github.com/nivdul/88d1dbb944f75c8bf612
Because I need to group my data by (user_id, activity) and then to sort them by timestamp, I decided to define the couple (user_id, activity) and timestamp, as a primary key.
Just below, an example of what my data looks like.
And now how to retrive the data from Cassandra with the Spark-Cassandra connector:
https://gist.github.com/nivdul/b5a3654488886cd36dc5
PREPARE MY DATA
As you can imagine my data was not clean, and I needed to prepare them to extract my features from it. It is certainly the most time consuming part of the work, but also the more exciting for me.
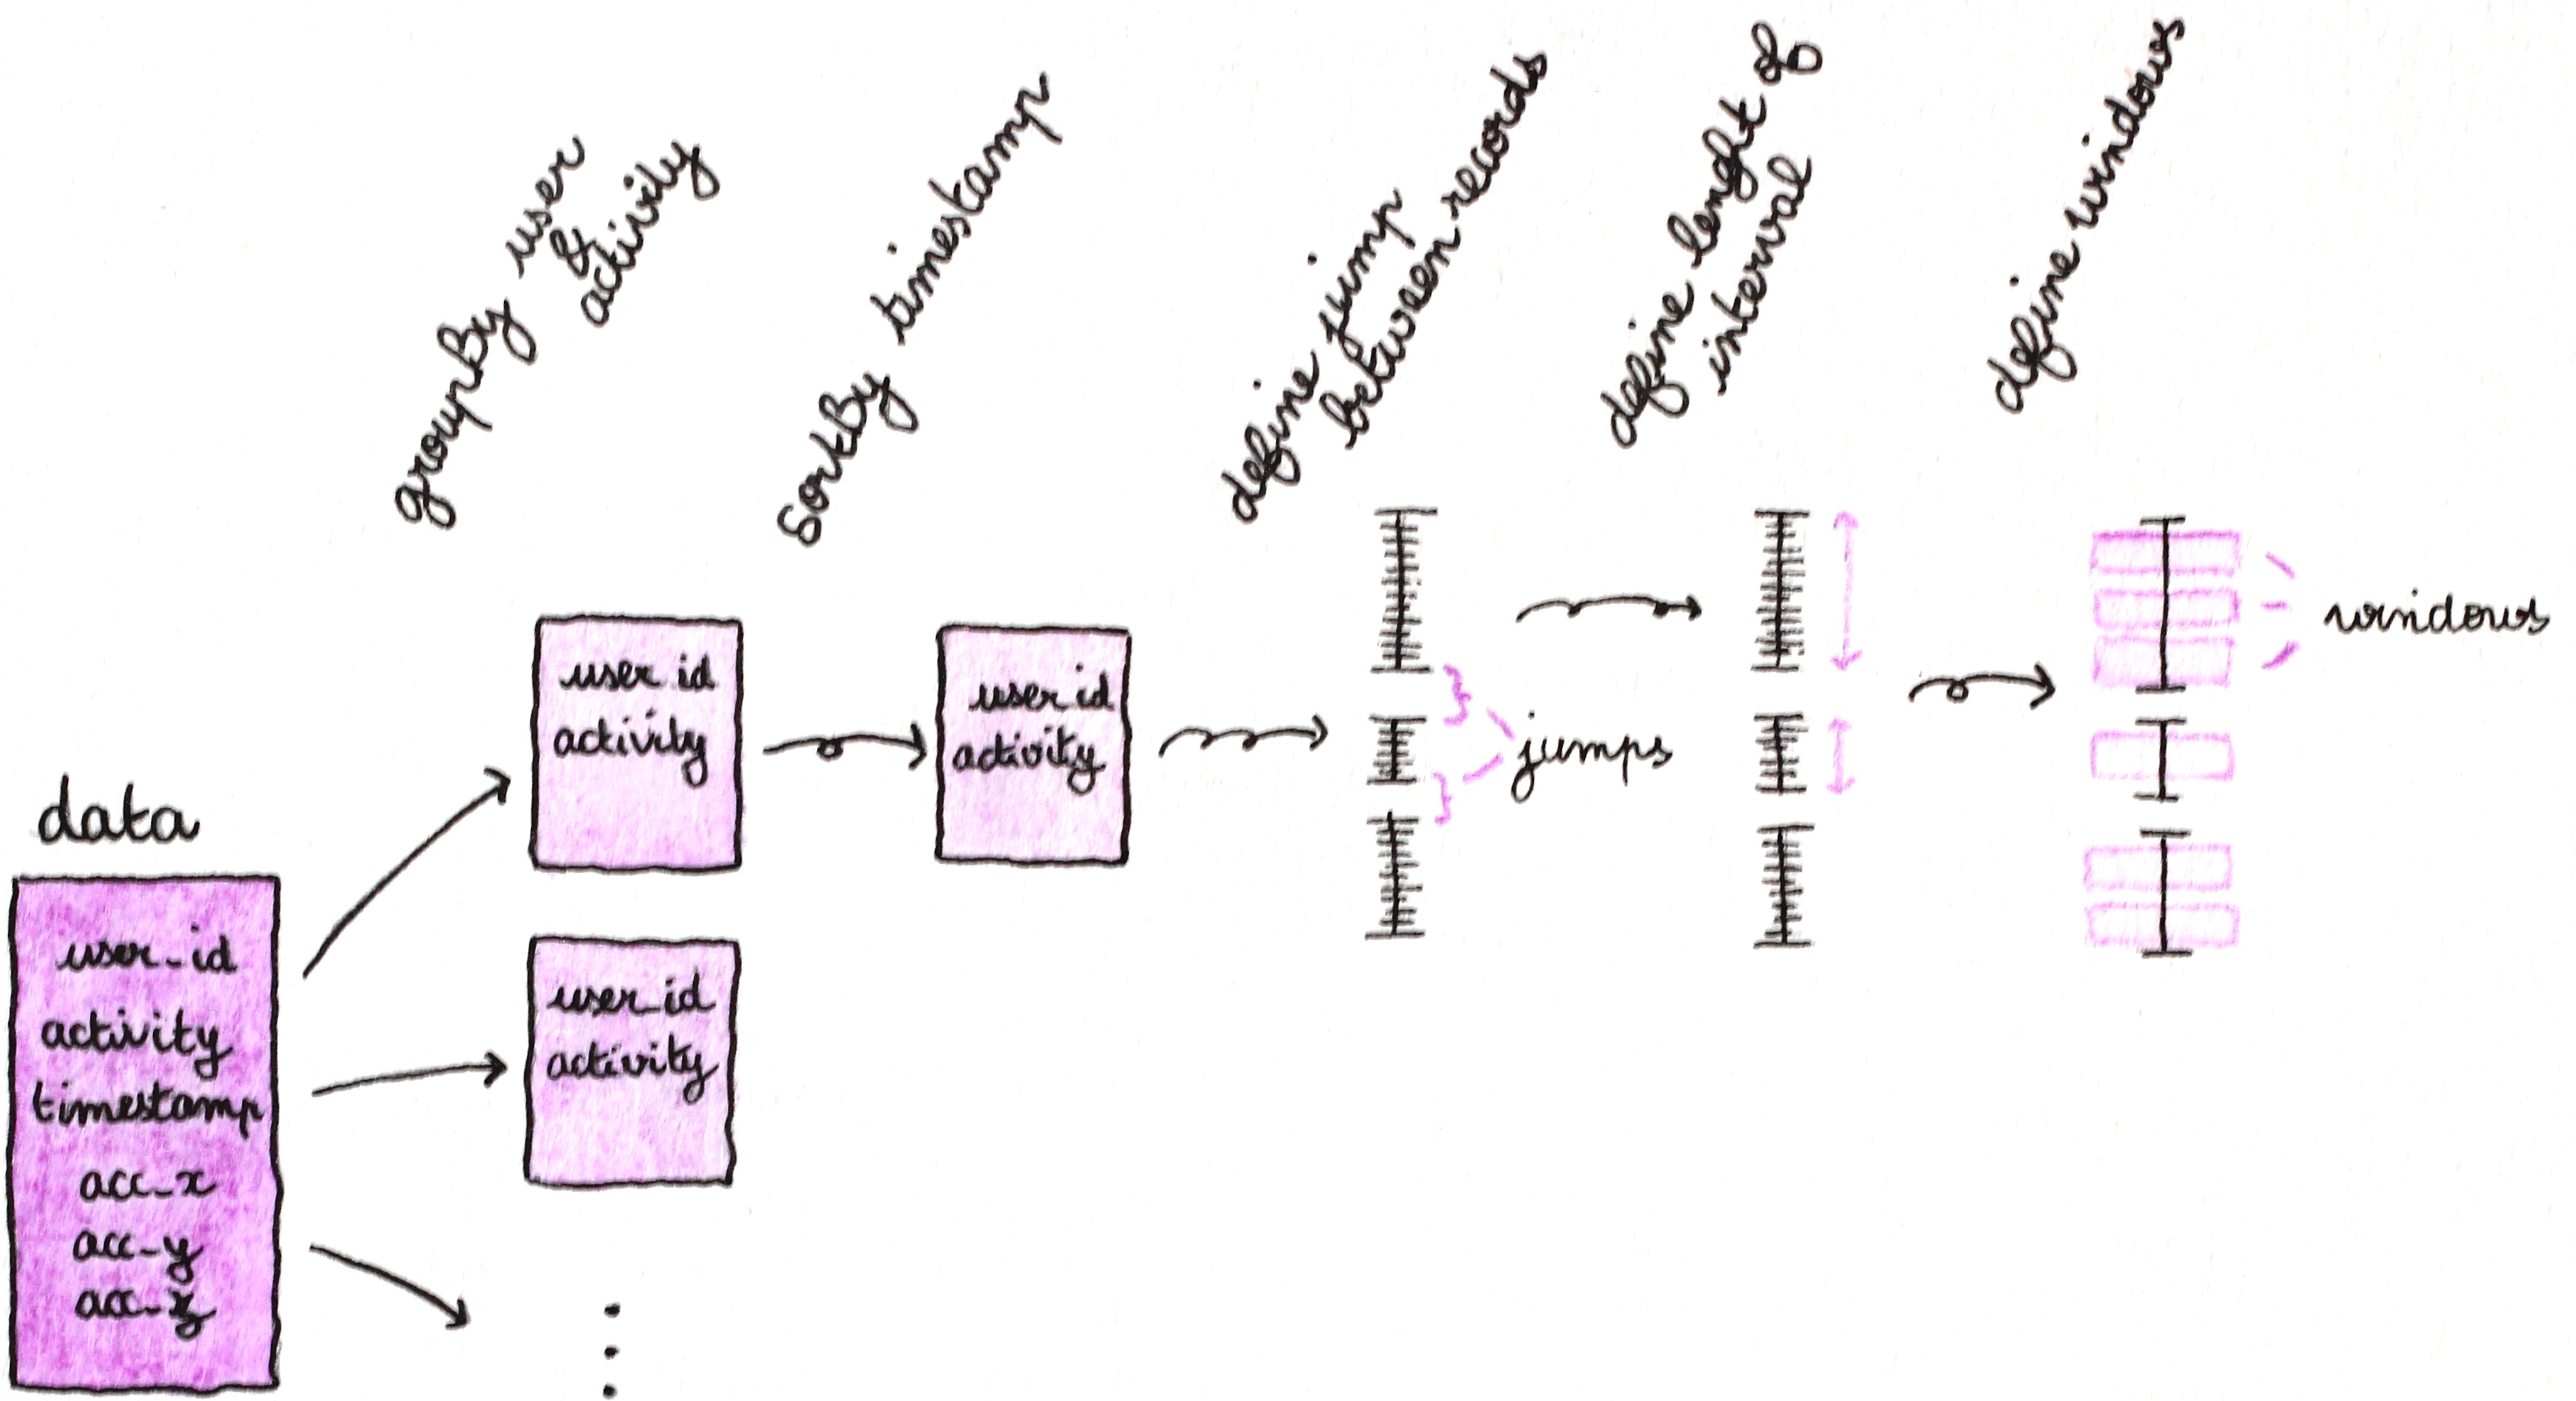
My data is contained in a csv file, and the data was acquired on different sequential days . So I needed to define the different recording intervals for each user and each activity. Thanks to these intervals, I have extracted windows on which I have computed my features.
Here is a diagram to explain what I did and the code.
First retrieve the data for each (user, activity) and sorted by timestamp.
https://gist.github.com/nivdul/6424b9b21745d8718036
Then search for the jumps between the records in order to define my recording intervals and the number of windows per intervals.
https://gist.github.com/nivdul/84b324f883dc86991332
DETERMINE AND COMPUTE FEATURES FOR THE MODEL
Each of these activities demonstrate characteristics that we will use to define the features of the model. For example, the plot for walking shows a series of high peaks for the y-axis spaced out approximately 0.5 seconds intervals, while it is rather a 0.25 seconds interval for jogging. We also notice that the range of the y-axis acceleration for jogging is greater than for walking, and so on. This analysis step is essential and takes time (again) to determine the best features to use for our model.
After several tests with different features combination, the ones that I have chosen are described below (it is basic statistics):
- Average acceleration (for each axis)
- Variance (for each axis)
- Average absolute difference (for each axis)
- Average resultant acceleration (1/n * sum [√(x² + y² + z²)])
- Average time between peaks (max) (Y-axis)
FEATURES COMPUTATION USING SPARK AND MLLIB
Now let’s compute the features to build the predictive model!
AVERAGE ACCELERATION AND VARIANCE
https://gist.github.com/nivdul/0ff01e13ba05135df09d
AVERAGE ABSOLUTE DIFFERENCE
https://gist.github.com/nivdul/1ee82f923991fea93bc6
AVERAGE RESULTANT ACCELERATION
https://gist.github.com/nivdul/666310c767cb6ef97503
AVERAGE TIME BETWEEN PEAKS
https://gist.github.com/nivdul/77225c0efee45a860d30
THE MODEL: DECISION TREES
Just to recap, we want to determine the user’s activity from data where the possible activities are: walking, jogging, sitting, standing, downstairs and upstairs. So it is a classification problem.
Here I have chosen the implementation of the Decision Trees algorithms using MLlib, to create my model and then to predict the activity performing by users.
You could also use others algorithms such as Random Forest or Multinomial Logistic Regression (from Spark 1.3) available in MLlib. **Remark**: with the chosen features, prediction for “up” and “down” activities are pretty bad. One trick would be to define more relevant features to have a better prediction model.
Below is the code that shows how to load our dataset, split it into training and testing datasets.
https://gist.github.com/nivdul/246dbe803a2345b7bf5b
Let’s use DecisionTree.trainClassifier to fit our model. After that the model is evaluated against the test dataset and an error is calculated to measure the algorithm accuracy.
https://gist.github.com/nivdul/f380586bfefc39b05f0c
RESULTS
| classes number | mean error (Random Forest) | mean error (Decision Tree) |
|---|---|---|
| 4 (4902 samples) | 1,3% | 1,5% |
| 6 (6100 samples) | 13,4% | 13,2% |
CONCLUSION
In this post we have first demonstrated how to use Apache Spark and Mllib to predict user’s physical activity.
The features extraction step is pretty long, because you need to test and experiment to find the best features as possible. We also have to prepare the data and the data processing is long too, but exciting.
If you find a better way/implementation to prepare the data or compute the features, do not hesitate to send a pull request or open an issue on github.


